Hugging Face Examples#
Simplifies Model Management and Collaboration#
Like Github but for AI/ML
Links:#
Website: https://huggingface.co/
Github: huggingface/
Hugging Face’s Open Souce Library of Powerful Tools. Examples:
Datasets | huggingface/datasets
one-line dataloaders & efficient data pre-processing
Transformers | huggingface/transformers
Transformers is a library of pretrained text, computer vision, audio, video, and multimodal models for inference and training. Use Transformers to fine-tune models on your data, build inference applications, and for AI use cases across multiple modalities.
Optimum | huggingface/optimum
set of optimization tools enabling maximum efficiency to train and run models on targeted hardware, while keeping things easy to use.
0: Setup:#
Install Hugging Face Libraries#
# Install Hugging Face libraries
!pip install transformers datasets huggingface_hub --upgrade
# Install Git LFS as needed
!apt-get install git-lfs
!git lfs install
Login to HF#
optional but good practice to avoid API limits and to access gated or private repos
from huggingface_hub import notebook_login
notebook_login()
1: Dataset Examples#
https://huggingface.co/docs/hub/storage-limits
Public Repositories Storage: unlimited
Private: 100GB
Enterprise Hub includes 1TB of private repository storage per seat in the subscription, i.e. if your organization has 40 members, then you have 40TB included storage for your private models and datasets.
List Datasets#
from huggingface_hub import list_datasets

results = list_datasets(author="akridge")
for ds in results:
    print(f"📦 {ds.id} — Tags: {ds.tags}")
📦 akridge/MOUSS_fish_imagery_dataset_grayscale_small — Tags: ['task_categories:object-detection', 'task_categories:image-classification', 'language:en', 'size_categories:1K<n<10K', 'format:imagefolder', 'modality:image', 'modality:text', 'library:datasets', 'library:mlcroissant', 'doi:10.57967/hf/3340', 'region:us', 'fish', 'underwater-imagery', 'grayscale', 'marine-biology']
📦 akridge/MOUSS_fish_segment_dataset_grayscale — Tags: ['task_categories:image-segmentation', 'language:en', 'size_categories:1K<n<10K', 'format:imagefolder', 'modality:image', 'modality:text', 'library:datasets', 'library:mlcroissant', 'doi:10.57967/hf/3341', 'region:us', 'fish', 'underwater-imagery', 'grayscale', 'marine-biology', 'segment']
📦 akridge/NOAA-ESD-CORAL-Bleaching-Dataset — Tags: ['task_categories:image-classification', 'language:en', 'size_categories:10K<n<100K', 'format:imagefolder', 'modality:image', 'library:datasets', 'library:mlcroissant', 'region:us', 'coral', 'bleaching', 'coral-reef', 'underwater-imagery', 'marine-biology', 'benthic-surveys', 'NOAA']
View Dataset Stats#
import requests
import json

dataset_id = "akridge/NOAA-ESD-CORAL-Bleaching-Dataset"
url = f"https://huggingface.co/api/datasets/{dataset_id}"

response = requests.get(url)
data = response.json()

# Pretty print summary
print(f"- Dataset: {data['id']}")
print(f"- Author: {data.get('author', 'n/a')}")
print(f"- Downloads: {data.get('downloads', 'n/a'):,}")
print(f"- Last modified: {data.get('lastModified', 'n/a')}")
print(f"- Task: {data.get('pipeline_tag', 'n/a')}")
print(f"- Tags: {data.get('tags', [])}")
print(f"- Card URL: https://huggingface.co/datasets/{dataset_id}")
- Dataset: akridge/NOAA-ESD-CORAL-Bleaching-Dataset
- Author: akridge
- Downloads: 252
- Last modified: 2025-02-21T00:35:59.000Z
- Task: n/a
- Tags: ['task_categories:image-classification', 'language:en', 'size_categories:10K<n<100K', 'format:imagefolder', 'modality:image', 'library:datasets', 'library:mlcroissant', 'region:us', 'coral', 'bleaching', 'coral-reef', 'underwater-imagery', 'marine-biology', 'benthic-surveys', 'NOAA']
- Card URL: https://huggingface.co/datasets/akridge/NOAA-ESD-CORAL-Bleaching-Dataset
from huggingface_hub import list_datasets
import pandas as pd
import requests
from tqdm import tqdm
from IPython.display import display, HTML

# Set author/org (change this to your own HF username if needed)
author = "akridge"  # or "FathomNet", etc.

# Step 1: Get list of datasets
datasets = list(list_datasets(author=author))

# Step 2: Enrich with detailed API info
dataset_data = []
for ds in tqdm(datasets, desc="Fetching dataset metadata"):
    dataset_id = ds.id
    url = f"https://huggingface.co/api/datasets/{dataset_id}"
    try:
        resp = requests.get(url)
        resp.raise_for_status()
        data = resp.json()
    except Exception as e:
        print(f"⚠️ Error fetching {dataset_id}: {e}")
        data = {}

    description = data.get("cardData", {}).get("summary", "")
    tags = data.get("tags", [])
    task = data.get("pipeline_tag", "")
    downloads = data.get("downloads", 0)
    likes = data.get("likes", 0)
    modified = data.get("lastModified", "n/a")
    author_name = data.get("author", "n/a")

    dataset_data.append({
        "Dataset": f'<a href="https://huggingface.co/datasets/{dataset_id}" target="_blank">{dataset_id}</a>',
        "Author": author_name,
        "Downloads": downloads,
        "Likes": likes,
        "Last Modified": modified,
        "Task": task,
        "Tags": ", ".join(tags),
        "Description": description
    })

# Step 3: Convert to DataFrame
df = pd.DataFrame(dataset_data)

# Step 4: Format and display as a styled HTML table in Colab
styled = df.style.set_table_attributes('class="dataframe table table-striped"') \
    .set_caption("📚 Hugging Face Datasets by Author") \
    .hide(axis="index") \
    .format(precision=0) \
    .background_gradient(subset=["Downloads", "Likes"], cmap="Blues")

# Step 5: Show result
display(HTML(styled.to_html(escape=False)))
Fetching dataset metadata: 100%|██████████| 3/3 [00:00<00:00, 3.68it/s]
| Dataset | Author | Downloads | Likes | Last Modified | Task | Tags | Description |
|---|---|---|---|---|---|---|---|
| akridge/MOUSS_fish_imagery_dataset_grayscale_small | akridge | 592 | 0 | 2025-01-24T00:35:24.000Z | task_categories:object-detection, task_categories:image-classification, language:en, size_categories:1K|
| | |
| akridge/MOUSS_fish_segment_dataset_grayscale | akridge | 179 | 0 | 2025-01-24T00:35:06.000Z | task_categories:image-segmentation, language:en, size_categories:1K|
| | |
| akridge/NOAA-ESD-CORAL-Bleaching-Dataset | akridge | 252 | 0 | 2025-02-21T00:35:59.000Z | task_categories:image-classification, language:en, size_categories:10K|
| |
View a Datasets Metadata as JSON#
import requests
import json
#Header and api only needed for private or gated datasets
#API_TOKEN = "your_huggingface_token_here"
#headers = {"Authorization": f"Bearer {API_TOKEN}"}
API_URL = "https://huggingface.co/api/datasets/akridge/NOAA-ESD-CORAL-Bleaching-Dataset/croissant"

def query():
    #response = requests.get(API_URL, headers=headers)
    response = requests.get(API_URL)
    return response.json()

data = query()
#print(data)
# Pretty Print
print(json.dumps(data, indent=2))
{
  "@context": {
    "@language": "en",
    "@vocab": "https://schema.org/",
    "citeAs": "cr:citeAs",
    "column": "cr:column",
    "conformsTo": "dct:conformsTo",
    "cr": "http://mlcommons.org/croissant/",
    "data": {
      "@id": "cr:data",
      "@type": "@json"
    },
    "dataBiases": "cr:dataBiases",
    "dataCollection": "cr:dataCollection",
    "dataType": {
      "@id": "cr:dataType",
      "@type": "@vocab"
    },
    "dct": "http://purl.org/dc/terms/",
    "extract": "cr:extract",
    "field": "cr:field",
    "fileProperty": "cr:fileProperty",
    "fileObject": "cr:fileObject",
    "fileSet": "cr:fileSet",
    "format": "cr:format",
    "includes": "cr:includes",
    "isLiveDataset": "cr:isLiveDataset",
    "jsonPath": "cr:jsonPath",
    "key": "cr:key",
    "md5": "cr:md5",
    "parentField": "cr:parentField",
    "path": "cr:path",
    "personalSensitiveInformation": "cr:personalSensitiveInformation",
    "recordSet": "cr:recordSet",
    "references": "cr:references",
    "regex": "cr:regex",
    "repeated": "cr:repeated",
    "replace": "cr:replace",
    "sc": "https://schema.org/",
    "separator": "cr:separator",
    "source": "cr:source",
    "subField": "cr:subField",
    "transform": "cr:transform"
  },
  "@type": "sc:Dataset",
  "distribution": [
    {
      "@type": "cr:FileObject",
      "@id": "repo",
      "name": "repo",
      "description": "The Hugging Face git repository.",
      "contentUrl": "https://huggingface.co/datasets/akridge/NOAA-ESD-CORAL-Bleaching-Dataset/tree/refs%2Fconvert%2Fparquet",
      "encodingFormat": "git+https",
      "sha256": "https://github.com/mlcommons/croissant/issues/80"
    },
    {
      "@type": "cr:FileSet",
      "@id": "parquet-files-for-config-default",
      "containedIn": {
        "@id": "repo"
      },
      "encodingFormat": "application/x-parquet",
      "includes": "default/*/*.parquet"
    }
  ],
  "recordSet": [
    {
      "@type": "cr:RecordSet",
      "dataType": "cr:Split",
      "key": {
        "@id": "default_splits/split_name"
      },
      "@id": "default_splits",
      "name": "default_splits",
      "description": "Splits for the default config.",
      "field": [
        {
          "@type": "cr:Field",
          "@id": "default_splits/split_name",
          "dataType": "sc:Text"
        }
      ],
      "data": [
        {
          "default_splits/split_name": "train"
        },
        {
          "default_splits/split_name": "validation"
        },
        {
          "default_splits/split_name": "test"
        }
      ]
    },
    {
      "@type": "cr:RecordSet",
      "@id": "default",
      "description": "akridge/NOAA-ESD-CORAL-Bleaching-Dataset - 'default' subset\n\nAdditional information:\n- 3 splits: train, validation, test",
      "field": [
        {
          "@type": "cr:Field",
          "@id": "default/split",
          "dataType": "sc:Text",
          "source": {
            "fileSet": {
              "@id": "parquet-files-for-config-default"
            },
            "extract": {
              "fileProperty": "fullpath"
            },
            "transform": {
              "regex": "default/(?:partial-)?(train|validation|test)/.+parquet$"
            }
          },
          "references": {
            "field": {
              "@id": "default_splits/split_name"
            }
          }
        },
        {
          "@type": "cr:Field",
          "@id": "default/image",
          "dataType": "sc:ImageObject",
          "source": {
            "fileSet": {
              "@id": "parquet-files-for-config-default"
            },
            "extract": {
              "column": "image"
            },
            "transform": {
              "jsonPath": "bytes"
            }
          }
        }
      ]
    }
  ],
  "conformsTo": "http://mlcommons.org/croissant/1.0",
  "name": "NOAA-ESD-CORAL-Bleaching-Dataset",
  "description": "\n\t\n\t\t\n\t\tDataset Card for NOAA-ESD-CORAL-Bleaching Classification Dataset v1\n\t\n\n\n\t\n\t\t\n\t\tOverview\n\t\n\nFor the development of machine learning models to classify coral health, specifically identifying healthy hard coral (CORAL) and bleached hard coral (CORAL_BL).This dataset contains underwater imagery collected by NOAA's Ecosystem Sciences Division (ESD) and other benthic surveys. \n\n\t\n\t\t\n\t\tLabels\n\t\n\n\n\t\n\t\t\nLabel\nName\nFunctional Group\n\n\n\t\t\nCORAL\nHealthy Hard Coral\nHard Coral\n\n\nCORAL_BL\nBleached\u2026 See the full description on the dataset page: https://huggingface.co/datasets/akridge/NOAA-ESD-CORAL-Bleaching-Dataset.",
  "alternateName": [
    "akridge/NOAA-ESD-CORAL-Bleaching-Dataset",
    "NOAA-ESD-CORAL-Bleaching-Dataset v1"
  ],
  "creator": {
    "@type": "Person",
    "name": "michael akridge",
    "url": "https://huggingface.co/akridge"
  },
  "keywords": [
    "image-classification",
    "English",
    "10K - 100K",
    "imagefolder",
    "Image",
    "Datasets",
    "Croissant",
    "\ud83c\uddfa\ud83c\uddf8 Region: US",
    "coral",
    "bleaching",
    "coral-reef",
    "underwater-imagery",
    "marine-biology",
    "benthic-surveys",
    "NOAA"
  ],
  "url": "https://huggingface.co/datasets/akridge/NOAA-ESD-CORAL-Bleaching-Dataset"
}
View a Datasets Metadata as a Dataframe#
import json
import pandas as pd
import requests

# Load Croissant-style metadata
url = "https://huggingface.co/api/datasets/akridge/NOAA-ESD-CORAL-Bleaching-Dataset/croissant"
croissant_meta = requests.get(url).json()

# Extract general metadata
info = {
    "Name": croissant_meta.get("name"),
    "Description": croissant_meta.get("description", "").strip().split("\n")[0],
    "Creator": croissant_meta.get("creator", {}).get("name"),
    "Creator URL": croissant_meta.get("creator", {}).get("url"),
    "Keywords": ", ".join(croissant_meta.get("keywords", [])),
    "URL": croissant_meta.get("url"),
    "Parquet Root": croissant_meta["distribution"][1].get("includes"),
    "Parquet Encoding": croissant_meta["distribution"][1].get("encodingFormat"),
    "Regex Split Extractor": croissant_meta["recordSet"][1]["field"][0]["source"]["transform"].get("regex")
}

# Extract splits
splits = [
    record["default_splits/split_name"]
    for record in croissant_meta.get("recordSet", [])[0].get("data", [])
]

info["Splits"] = ", ".join(splits)

# Convert to DataFrame
df = pd.DataFrame([info])
df.T  # Transposed for better readability
| 0 | |
|---|---|
| Name | NOAA-ESD-CORAL-Bleaching-Dataset |
| Description | Dataset Card for NOAA-ESD-CORAL-Bleaching Clas... |
| Creator | michael akridge |
| Creator URL | https://huggingface.co/akridge |
| Keywords | image-classification, English, 10K - 100K, ima... |
| URL | https://huggingface.co/datasets/akridge/NOAA-E... |
| Parquet Root | default/*/*.parquet |
| Parquet Encoding | application/x-parquet |
| Regex Split Extractor | default/(?:partial-)?(train|validation|test)/.... |
| Splits | train, validation, test |
2: Model Examples#
View Model Stats#
import requests

response = requests.get("https://huggingface.co/api/models/akridge/noaa-esd-coral-bleaching-vit-classifier-v1")
data = response.json()

print(f"- Author: {data['author']}")
print(f"- Downloads: {data['downloads']:,}")
print(f"- Last modified: {data['lastModified']}")
print(f"- Tasks: {data['pipeline_tag']}")
- Author: akridge
- Downloads: 19
- Last modified: 2025-02-26T17:26:08.000Z
- Tasks: image-classification
View a Model Card Details#
from huggingface_hub import ModelCard, hf_hub_download

# Download and parse the model card
card_text = hf_hub_download(repo_id="akridge/noaa-esd-coral-bleaching-vit-classifier-v1", filename="README.md")
card = ModelCard.load(card_text)

# Show sections like model details, datasets, metrics
print("Model Card Sections:")
print(card.data)
📘 Model Card Sections:
base_model:
- google/vit-base-patch16-224
datasets:
- akridge/NOAA-ESD-CORAL-Bleaching-Dataset
language:
- en
library_name: transformers
license: agpl-3.0
pipeline_tag: image-classification
tags:
- vit
- vision-transformer
- coral
- coral-bleaching
- image-classification
- NOAA
- marine-ecosystem
model-index:
- name: noaa-esd-coral-bleaching-vit-classifier-v1
  results:
  - task:
      type: image-classification
    dataset:
      name: NOAA-ESD-CORAL-Bleaching-Dataset
      type: NOAA-ESD-CORAL-Bleaching-Dataset
    metrics:
    - type: accuracy
      value: 0.85
    - type: precision
      value: 0.84
    - type: recall
      value: 0.75
View Model Card Template#
from huggingface_hub import ModelCard, ModelCardData

# Define structured metadata
card_data = ModelCardData(
    model_name="my-coral-model-example",
    tags=["image-classification", "marine-biology"]
)

# Generate card text from template
card = ModelCard.from_template(card_data=card_data, template="model")
print(card.text)
# Model Card for Model ID

<!-- Provide a quick summary of what the model is/does. -->


## Model Details

### Model Description

<!-- Provide a longer summary of what this model is. -->


- **Developed by:** [More Information Needed]
- **Funded by [optional]:** [More Information Needed]
- **Shared by [optional]:** [More Information Needed]
- **Model type:** [More Information Needed]
- **Language(s) (NLP):** [More Information Needed]
- **License:** [More Information Needed]
- **Finetuned from model [optional]:** [More Information Needed]

### Model Sources [optional]

<!-- Provide the basic links for the model. -->

- **Repository:** [More Information Needed]
- **Paper [optional]:** [More Information Needed]
- **Demo [optional]:** [More Information Needed]

## Uses

<!-- Address questions around how the model is intended to be used, including the foreseeable users of the model and those affected by the model. -->

### Direct Use

<!-- This section is for the model use without fine-tuning or plugging into a larger ecosystem/app. -->

[More Information Needed]

### Downstream Use [optional]

<!-- This section is for the model use when fine-tuned for a task, or when plugged into a larger ecosystem/app -->

[More Information Needed]

### Out-of-Scope Use

<!-- This section addresses misuse, malicious use, and uses that the model will not work well for. -->

[More Information Needed]

## Bias, Risks, and Limitations

<!-- This section is meant to convey both technical and sociotechnical limitations. -->

[More Information Needed]

### Recommendations

<!-- This section is meant to convey recommendations with respect to the bias, risk, and technical limitations. -->

Users (both direct and downstream) should be made aware of the risks, biases and limitations of the model. More information needed for further recommendations.

## How to Get Started with the Model

Use the code below to get started with the model.

[More Information Needed]

## Training Details

### Training Data

<!-- This should link to a Dataset Card, perhaps with a short stub of information on what the training data is all about as well as documentation related to data pre-processing or additional filtering. -->

[More Information Needed]

### Training Procedure

<!-- This relates heavily to the Technical Specifications. Content here should link to that section when it is relevant to the training procedure. -->

#### Preprocessing [optional]

[More Information Needed]


#### Training Hyperparameters

- **Training regime:** [More Information Needed] <!--fp32, fp16 mixed precision, bf16 mixed precision, bf16 non-mixed precision, fp16 non-mixed precision, fp8 mixed precision -->

#### Speeds, Sizes, Times [optional]

<!-- This section provides information about throughput, start/end time, checkpoint size if relevant, etc. -->

[More Information Needed]

## Evaluation

<!-- This section describes the evaluation protocols and provides the results. -->

### Testing Data, Factors & Metrics

#### Testing Data

<!-- This should link to a Dataset Card if possible. -->

[More Information Needed]

#### Factors

<!-- These are the things the evaluation is disaggregating by, e.g., subpopulations or domains. -->

[More Information Needed]

#### Metrics

<!-- These are the evaluation metrics being used, ideally with a description of why. -->

[More Information Needed]

### Results

[More Information Needed]

#### Summary


## Model Examination [optional]

<!-- Relevant interpretability work for the model goes here -->

[More Information Needed]

## Environmental Impact

<!-- Total emissions (in grams of CO2eq) and additional considerations, such as electricity usage, go here. Edit the suggested text below accordingly -->

Carbon emissions can be estimated using the [Machine Learning Impact calculator](https://mlco2.github.io/impact#compute) presented in [Lacoste et al. (2019)](https://arxiv.org/abs/1910.09700).

- **Hardware Type:** [More Information Needed]
- **Hours used:** [More Information Needed]
- **Cloud Provider:** [More Information Needed]
- **Compute Region:** [More Information Needed]
- **Carbon Emitted:** [More Information Needed]

## Technical Specifications [optional]

### Model Architecture and Objective

[More Information Needed]

### Compute Infrastructure

[More Information Needed]

#### Hardware

[More Information Needed]

#### Software

[More Information Needed]

## Citation [optional]

<!-- If there is a paper or blog post introducing the model, the APA and Bibtex information for that should go in this section. -->

**BibTeX:**

[More Information Needed]

**APA:**

[More Information Needed]

## Glossary [optional]

<!-- If relevant, include terms and calculations in this section that can help readers understand the model or model card. -->

[More Information Needed]

## More Information [optional]

[More Information Needed]

## Model Card Authors [optional]

[More Information Needed]

## Model Card Contact

[More Information Needed]
Automate Model Card Readme#
from huggingface_hub import ModelCard, ModelCardData

# Step 1: Define structured metadata for your model
card_data = ModelCardData(
    model_name="yolov11n-cls-noaa-esd-coral-bleaching-classifier",
    language=["en"],
    license="mit",
    tags=["image-classification", "marine-biology", "coral", "yolo", "ultralytics"],
    library_name="ultralytics",
    datasets=["akridge/NOAA-ESD-CORAL-Bleaching-Dataset"],
    metrics=["accuracy"],
    model_description="YOLOv11n classifier for detecting healthy vs. bleached coral from NOAA ESD image surveys.",
    intended_uses="This model is designed for monitoring coral reef health using automated classification.",
    limitations="May not generalize well to non-NOAA reef imagery or non-Pacific coral communities.",
    ethical_considerations="Intended only for ecological monitoring. Avoid over-reliance without expert validation.",
)

# Step 2: Generate the card text using the default 'model' template
card = ModelCard.from_template(card_data=card_data, template="model")

# Step 3: Save the README.md locally
with open("README.md", "w") as f:
    f.write(card.text)

print("Model card generated and saved as README.md")
Model card generated and saved as README.md
3: Hugging Face Git Workflow Example | Repo Clone & Manage#
from getpass import getpass
import os

#  Prompt for token and user info
huggingface_token = getpass("Enter your Hugging Face token: ")
username = "akridge"  # Replace with your HF username
user_email = input("Enter your Hugging Face email: ")
repo_name = "noaa-esd-coral-bleaching-vit-classifier-v1"
branch_name = "update-readme-2025-05"

#  Configure Git
os.system(f"git config --global user.email '{user_email}'")
os.system(f"git config --global user.name '{username}'")
os.system("git config --global credential.helper store")
os.system(f"echo 'https://{username}:{huggingface_token}@huggingface.co' > ~/.git-credentials")

#  Clone the repo
os.system(f"git clone https://huggingface.co/{username}/{repo_name}")
os.chdir(f"/content/{repo_name}")

#  Create and switch to a new branch
os.system(f"git checkout -b {branch_name}")

#  Update README.md
with open("README.md", "a") as f:
    f.write("\n\n## Update – May 2025\nNow includes example prediction using `pipeline()` and support for `.gif`.\n")

#  Install Git LFS and track GIFs
os.system("apt-get install -y git-lfs")
os.system("git lfs install")
os.system("git lfs track '*.gif'")
os.system("git add .gitattributes")

#  Commit and push changes
os.system("git add README.md coral_demo.gif")
os.system(f"git commit -m 'Update README and add coral_demo.gif with Git LFS tracking'")
os.system(f"git push origin {branch_name}")
4: HF | Query Dataset without Downloading it#
import duckdb

query = """
DESCRIBE SELECT *
FROM 'hf://datasets/akridge/NOAA-ESD-CORAL-Bleaching-Dataset@~parquet/default/train/*.parquet'
"""

con = duckdb.connect()
print(con.sql(query).df())
  column_name                       column_type null   key default extra
0       image  STRUCT(bytes BLOB, path VARCHAR)  YES  None    None  None
Query Dataset Split#
import duckdb

con = duckdb.connect()

query = """
SELECT 'train' AS split, COUNT(*) AS count FROM 'hf://datasets/akridge/NOAA-ESD-CORAL-Bleaching-Dataset@~parquet/default/train/*.parquet'
UNION ALL
SELECT 'validation' AS split, COUNT(*) AS count FROM 'hf://datasets/akridge/NOAA-ESD-CORAL-Bleaching-Dataset@~parquet/default/validation/*.parquet'
UNION ALL
SELECT 'test' AS split, COUNT(*) AS count FROM 'hf://datasets/akridge/NOAA-ESD-CORAL-Bleaching-Dataset@~parquet/default/test/*.parquet'
"""

df = con.sql(query).df()
print(df)
        split  count
0       train   7292
1  validation   1562
2        test   1565
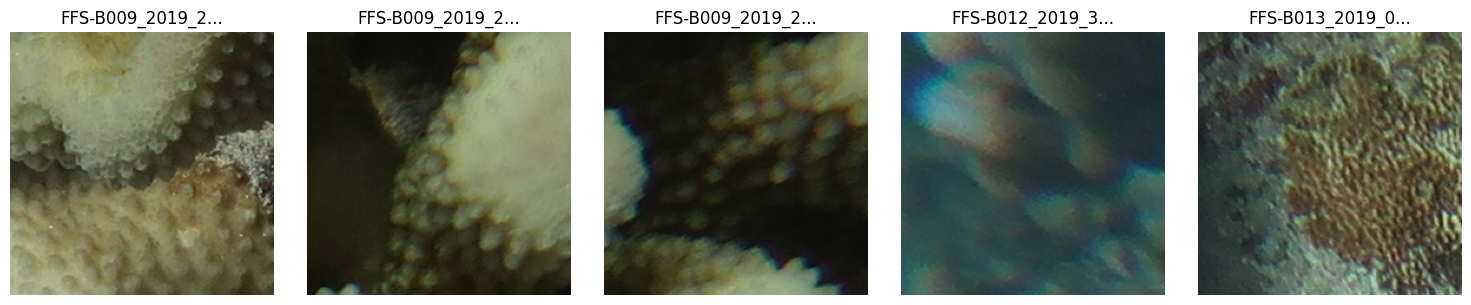
Query Images#
con.sql("""
SELECT image.path
FROM 'hf://datasets/akridge/NOAA-ESD-CORAL-Bleaching-Dataset@~parquet/default/train/*.parquet'
LIMIT 5
""").df()
| path | |
|---|---|
| 0 | FFS-B009_2019_27_263.PNG |
| 1 | FFS-B009_2019_27_264.PNG |
| 2 | FFS-B009_2019_27_265.PNG |
| 3 | FFS-B012_2019_38_671.PNG |
| 4 | FFS-B013_2019_05_922.PNG |
import duckdb
import io
from PIL import Image
import matplotlib.pyplot as plt

# Connect and query image.bytes + image.path
con = duckdb.connect()
con.execute("INSTALL httpfs;")
con.execute("LOAD httpfs;")

query = """
SELECT image.bytes, image.path
FROM 'hf://datasets/akridge/NOAA-ESD-CORAL-Bleaching-Dataset@~parquet/default/train/*.parquet'
LIMIT 5
"""

results = con.sql(query).fetchall()
# Create subplot
fig, axs = plt.subplots(1, 5, figsize=(15, 3))

for i, (img_bytes, path) in enumerate(results):
    img = Image.open(io.BytesIO(img_bytes))
    axs[i].imshow(img)
    axs[i].axis('off')
    axs[i].set_title(path[:15] + "...")  # truncate path if long

plt.tight_layout()
plt.show()
import requests
import json
import getpass  # secure input without echo

# Prompt the user for Hugging Face token
API_TOKEN = getpass.getpass("Enter your Hugging Face token: ")
headers = {"Authorization": f"Bearer {API_TOKEN}"}

# API endpoint
API_URL = "https://datasets-server.huggingface.co/parquet?dataset=akridge/NOAA-ESD-CORAL-Bleaching-Dataset"

def query():
    response = requests.get(API_URL, headers=headers)
    response.raise_for_status()
    return response.json()

# Fetch and pretty-print
data = query()
print(json.dumps(data, indent=2))
Enter your Hugging Face token: ··········
{
  "parquet_files": [
    {
      "dataset": "akridge/NOAA-ESD-CORAL-Bleaching-Dataset",
      "config": "default",
      "split": "test",
      "url": "https://huggingface.co/datasets/akridge/NOAA-ESD-CORAL-Bleaching-Dataset/resolve/refs%2Fconvert%2Fparquet/default/test/0000.parquet",
      "filename": "0000.parquet",
      "size": 116131449
    },
    {
      "dataset": "akridge/NOAA-ESD-CORAL-Bleaching-Dataset",
      "config": "default",
      "split": "train",
      "url": "https://huggingface.co/datasets/akridge/NOAA-ESD-CORAL-Bleaching-Dataset/resolve/refs%2Fconvert%2Fparquet/default/train/0000.parquet",
      "filename": "0000.parquet",
      "size": 499955366
    },
    {
      "dataset": "akridge/NOAA-ESD-CORAL-Bleaching-Dataset",
      "config": "default",
      "split": "train",
      "url": "https://huggingface.co/datasets/akridge/NOAA-ESD-CORAL-Bleaching-Dataset/resolve/refs%2Fconvert%2Fparquet/default/train/0001.parquet",
      "filename": "0001.parquet",
      "size": 36752192
    },
    {
      "dataset": "akridge/NOAA-ESD-CORAL-Bleaching-Dataset",
      "config": "default",
      "split": "validation",
      "url": "https://huggingface.co/datasets/akridge/NOAA-ESD-CORAL-Bleaching-Dataset/resolve/refs%2Fconvert%2Fparquet/default/validation/0000.parquet",
      "filename": "0000.parquet",
      "size": 115141808
    }
  ],
  "pending": [],
  "failed": [],
  "partial": false
}
5: Load Model and/or Dataset from HF#
from datasets import load_dataset
from transformers import ViTForImageClassification, AutoImageProcessor

# Load model and processor from Hugging Face
model_id = "akridge/noaa-esd-coral-bleaching-vit-classifier-v1"
model = ViTForImageClassification.from_pretrained(model_id)
processor = AutoImageProcessor.from_pretrained(model_id)

# Load validation split of the dataset
dataset = load_dataset("akridge/NOAA-ESD-CORAL-Bleaching-Dataset", split="validation")
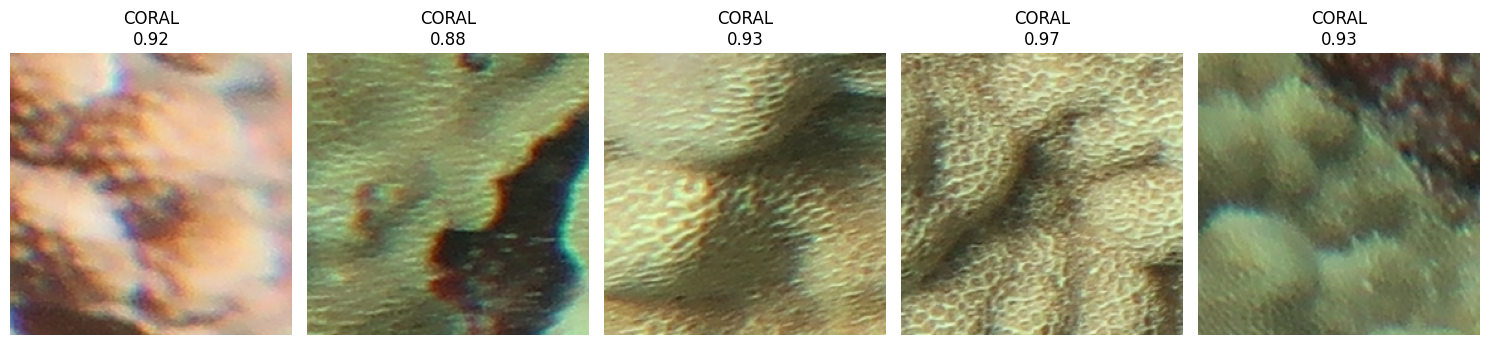
6: Use HF as a Pipeline for Inference#
from datasets import load_dataset
from itertools import islice
from transformers import pipeline
import matplotlib.pyplot as plt

# Load validation split in streaming mode or point to local images
dataset = load_dataset("akridge/NOAA-ESD-CORAL-Bleaching-Dataset", split="validation", streaming=True)

# Load image classification pipeline
classifier = pipeline("image-classification", model="akridge/noaa-esd-coral-bleaching-vit-classifier-v1")

# Get just 5 examples
examples = list(islice(dataset, 5))

# Plot with predictions only
plt.figure(figsize=(15, 4))

for i, example in enumerate(examples):
    image = example["image"]
    pred = classifier(image)[0]  # top prediction

    plt.subplot(1, 5, i + 1)
    plt.imshow(image)
    plt.title(f"{pred['label']}\n{pred['score']:.2f}")
    plt.axis('off')

plt.tight_layout()
plt.show()
/usr/local/lib/python3.11/dist-packages/huggingface_hub/utils/_auth.py:94: UserWarning:
The secret `HF_TOKEN` does not exist in your Colab secrets.
To authenticate with the Hugging Face Hub, create a token in your settings tab (https://huggingface.co/settings/tokens), set it as secret in your Google Colab and restart your session.
You will be able to reuse this secret in all of your notebooks.
Please note that authentication is recommended but still optional to access public models or datasets.
  warnings.warn(
Some datasets params were ignored: ['images']. Make sure to use only valid params for the dataset builder and to have a up-to-date version of the `datasets` library.
WARNING:datasets.load:Some datasets params were ignored: ['images']. Make sure to use only valid params for the dataset builder and to have a up-to-date version of the `datasets` library.
Using a slow image processor as `use_fast` is unset and a slow processor was saved with this model. `use_fast=True` will be the default behavior in v4.52, even if the model was saved with a slow processor. This will result in minor differences in outputs. You'll still be able to use a slow processor with `use_fast=False`.
Device set to use cpu
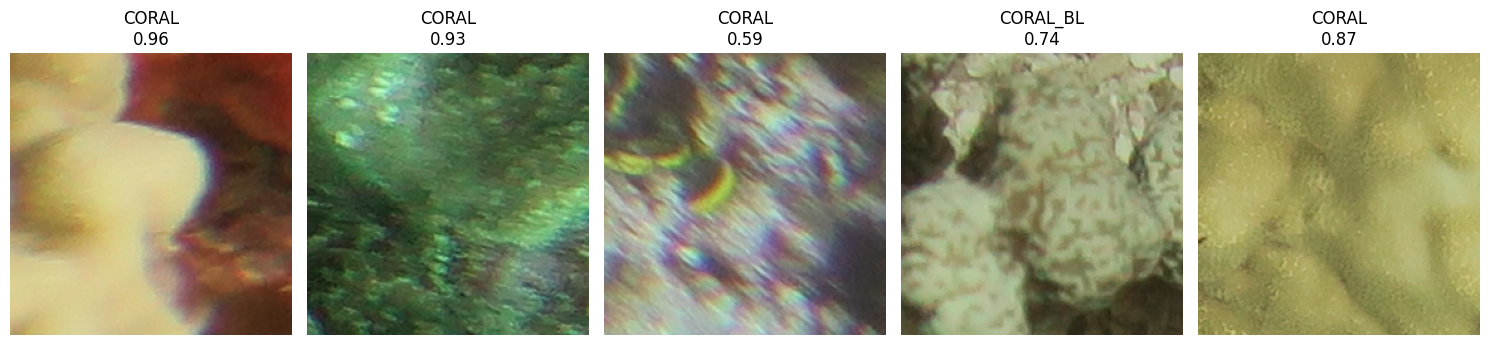
import random
from datasets import load_dataset
from itertools import islice
from transformers import pipeline
import matplotlib.pyplot as plt

# Load test set in streaming mode
dataset = load_dataset("akridge/NOAA-ESD-CORAL-Bleaching-Dataset", split="test", streaming=True)

# Buffer N examples (e.g. 100), then randomly pick 5
buffered = list(islice(dataset, 100))
examples = random.sample(buffered, 5)

# Load classifier
classifier = pipeline("image-classification", model="akridge/noaa-esd-coral-bleaching-vit-classifier-v1")

# Plot predictions
plt.figure(figsize=(15, 4))

for i, example in enumerate(examples):
    image = example["image"]
    pred = classifier(image)[0]

    plt.subplot(1, 5, i + 1)
    plt.imshow(image)
    plt.title(f"{pred['label']}\n{pred['score']:.2f}")
    plt.axis('off')

plt.tight_layout()
plt.show()
Some datasets params were ignored: ['images']. Make sure to use only valid params for the dataset builder and to have a up-to-date version of the `datasets` library.
WARNING:datasets.load:Some datasets params were ignored: ['images']. Make sure to use only valid params for the dataset builder and to have a up-to-date version of the `datasets` library.
Device set to use cpu
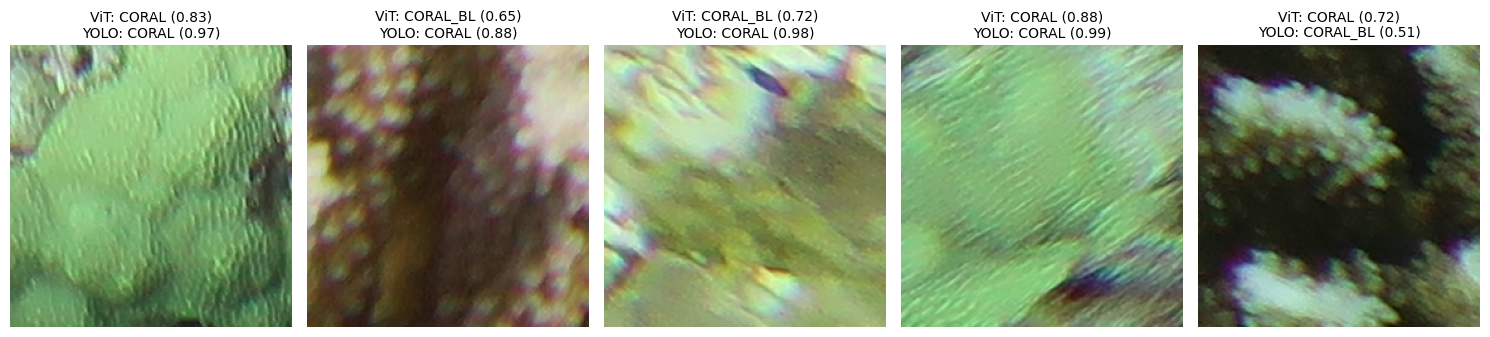
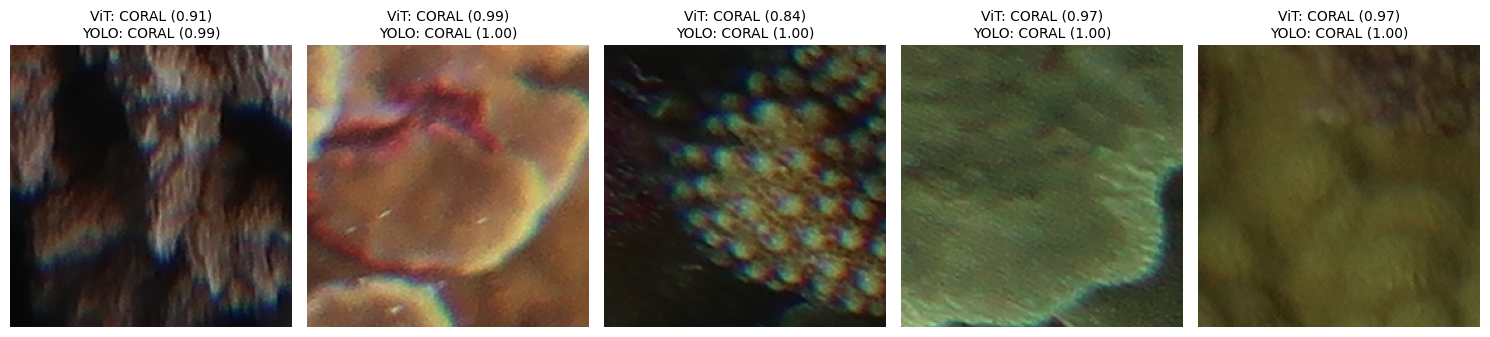
7: Compare predictions from two models#
# install to use yolo model
!pip install ultralytics
# Download Yolo Model
# Make the folder if it doesn't exist
!mkdir -p /content/models
# Download the model into the folder with a cleaner filename
!wget -O /content/models/yolov11n-cls-noaa-esd-coral-bleaching-classifier.pt "https://huggingface.co/akridge/yolo11n-cls-noaa-esd-coral-bleaching/resolve/main/yolov11n-cls-noaa-esd-coral-bleaching-classifier.pt?download=true"
import random
from datasets import load_dataset
from itertools import islice
from transformers import pipeline
import matplotlib.pyplot as plt
from PIL import Image
from ultralytics import YOLO

# Step 1: Load 5 random images from the test set (streaming)
dataset = load_dataset("akridge/NOAA-ESD-CORAL-Bleaching-Dataset", split="validation", streaming=True)
buffered = list(islice(dataset, 100))
examples = random.sample(buffered, 5)

# Step 2: Load models
vit_model = pipeline("image-classification", model="akridge/noaa-esd-coral-bleaching-vit-classifier-v1")
yolo_model = YOLO("/content/models/yolov11n-cls-noaa-esd-coral-bleaching-classifier.pt")

# Step 3: Predict and plot
plt.figure(figsize=(15, 5))

for i, example in enumerate(examples):
    image = example["image"]

    # ViT prediction
    vit_pred = vit_model(image)[0]

    # YOLOv11n prediction
    yolo_result = yolo_model(image, verbose=False)[0]
    yolo_label = yolo_result.names[int(yolo_result.probs.top1)]
    yolo_score = yolo_result.probs.top1conf.item()

    # Plot
    plt.subplot(1, 5, i + 1)
    plt.imshow(image)
    plt.axis('off')
    plt.title(f"ViT: {vit_pred['label']} ({vit_pred['score']:.2f})\nYOLO: {yolo_label} ({yolo_score:.2f})", fontsize=10)

plt.tight_layout()
plt.show()
Some datasets params were ignored: ['images']. Make sure to use only valid params for the dataset builder and to have a up-to-date version of the `datasets` library.
WARNING:datasets.load:Some datasets params were ignored: ['images']. Make sure to use only valid params for the dataset builder and to have a up-to-date version of the `datasets` library.
Device set to use cpu
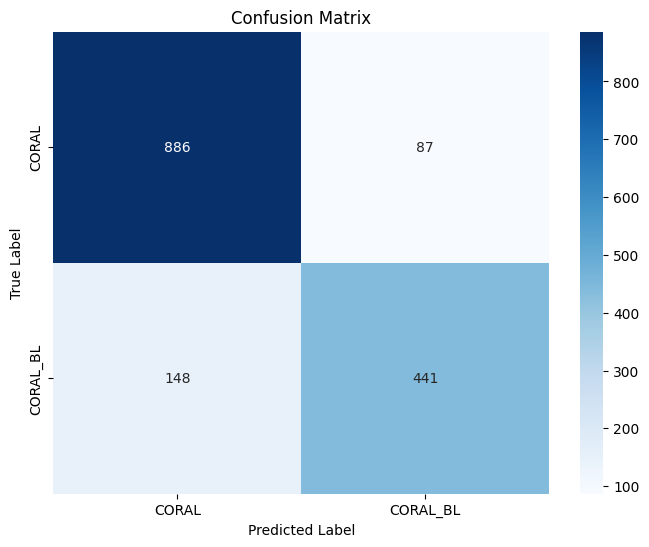
8: Run Model/Dataset Validation#
import torch
from torch.utils.data import DataLoader
from datasets import load_dataset
from transformers import ViTForImageClassification, AutoImageProcessor
from sklearn.metrics import classification_report, confusion_matrix
import matplotlib.pyplot as plt
import seaborn as sns
import numpy as np

# Load model and processor from Hugging Face Hub
model_id = "akridge/noaa-esd-coral-bleaching-vit-classifier-v1"
model = ViTForImageClassification.from_pretrained(model_id).to("cuda" if torch.cuda.is_available() else "cpu")
processor = AutoImageProcessor.from_pretrained(model_id)
model.eval()

# Load validation split of the dataset directly from the Hub
dataset = load_dataset("akridge/NOAA-ESD-CORAL-Bleaching-Dataset", split="validation")

# Preprocess function
def preprocess(example):
    inputs = processor(images=example["image"], return_tensors="pt")
    example["pixel_values"] = inputs["pixel_values"][0]
    return example

# Apply preprocessing
dataset = dataset.map(preprocess, batched=False)

# DataLoader
BATCH_SIZE = 32

def collate_fn(batch):
    pixel_values = torch.stack([example["pixel_values"] for example in batch])
    labels = torch.tensor([example["label"] for example in batch])
    return {"pixel_values": pixel_values, "labels": labels}

val_loader = DataLoader(dataset, batch_size=BATCH_SIZE, collate_fn=collate_fn)

# Run evaluation
device = "cuda" if torch.cuda.is_available() else "cpu"
y_true, y_pred = [], []

for batch in val_loader:
    pixel_values = batch["pixel_values"].to(device)
    labels = batch["labels"].to(device)
    with torch.no_grad():
        outputs = model(pixel_values)
        preds = outputs.logits.argmax(dim=-1)
    y_true.extend(labels.cpu().numpy())
    y_pred.extend(preds.cpu().numpy())

# Report + Confusion Matrix
id2label = model.config.id2label
labels = list(id2label.values())
report = classification_report(y_true, y_pred, target_names=labels)
print(" Classification Report:\n", report)

cm = confusion_matrix(y_true, y_pred)
plt.figure(figsize=(8, 6))
sns.heatmap(cm, annot=True, fmt='d', cmap="Blues", xticklabels=labels, yticklabels=labels)
plt.title("Confusion Matrix")
plt.xlabel("Predicted Label")
plt.ylabel("True Label")
plt.show()
📄 Classification Report:
               precision    recall  f1-score   support

       CORAL       0.86      0.91      0.88       973
    CORAL_BL       0.84      0.75      0.79       589

    accuracy                           0.85      1562
   macro avg       0.85      0.83      0.84      1562
weighted avg       0.85      0.85      0.85      1562
import onnx
import onnxruntime as ort
import torch
from PIL import Image
import matplotlib.pyplot as plt
from transformers import ViTForImageClassification, AutoImageProcessor

#  Load the ONNX model
onnx_model_path = "/content/coral_vit_model_opset14.onnx"
onnx_model = onnx.load(onnx_model_path)
onnx.checker.check_model(onnx_model)  # Check model integrity
ort_session = ort.InferenceSession(onnx_model_path)

#  Load the original model and processor
model_path = "/content/coral_vit_model"
original_model = ViTForImageClassification.from_pretrained(model_path)
processor = AutoImageProcessor.from_pretrained(model_path)
original_model.eval()

#  Load label mappings
id2label = original_model.config.id2label

#  Load and preprocess a sample image
image_path = "/content/FFS-B012_2019_41_703.PNG"  # Replace with your test image
image = Image.open(image_path).convert("RGB")
inputs = processor(images=image, return_tensors="pt")

#  Predict with the original PyTorch model
with torch.no_grad():
    original_outputs = original_model(**inputs)
    original_prediction = original_outputs.logits.argmax(-1).item()

#  Predict with the ONNX model
onnx_inputs = {"input": inputs["pixel_values"].numpy()}  # Match ONNX input name
onnx_outputs = ort_session.run(None, onnx_inputs)
onnx_prediction = onnx_outputs[0].argmax(axis=1)[0]

#  Compare predictions and visualize
print(f"Original Model Prediction: {original_prediction} ({id2label[original_prediction]})")
print(f"ONNX Model Prediction: {onnx_prediction} ({id2label[onnx_prediction]})")

#  Plot the image with predictions
plt.imshow(image)
plt.title(f"Original: {id2label[original_prediction]} | ONNX: {id2label[onnx_prediction]}")
plt.axis("off")
plt.show()

#  Check if predictions match
assert original_prediction == onnx_prediction, " Predictions differ between models!"
print(" Validation successful: Both models produce the same prediction.")
Original Model Prediction: 1 (CORAL_BL)
ONNX Model Prediction: 1 (CORAL_BL)
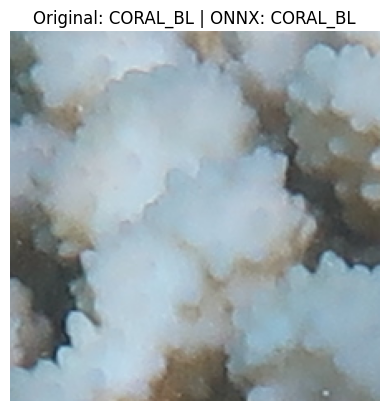
✅ Validation successful: Both models produce the same prediction.
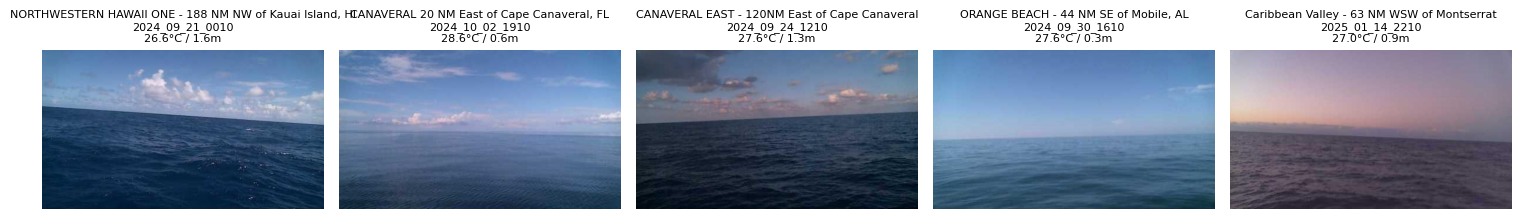
09: 0ther Examples | Explore NOAA Buoycam Data via Parquet#
View Sample of NOAA Buoycam Data#
import duckdb
import io
from PIL import Image
import matplotlib.pyplot as plt

# Step 1: Connect and enable remote parquet access
con = duckdb.connect()
con.execute("INSTALL httpfs;")
con.execute("LOAD httpfs;")

# Step 2: Query image bytes + relevant JSON metadata
query = """
SELECT
  jpg.bytes,
  jpg.path,
  json ->> 'timestamp' AS timestamp,
  json ->> 'description' AS description,
  json ->> 'air_temperature_c' AS air_temp,
  json ->> 'wave_height_m' AS wave_h
FROM 'hf://datasets/brianofrim/NOAA_buoycams@~parquet/default/validation/*.parquet'
WHERE jpg.bytes IS NOT NULL
LIMIT 5
"""

results = con.sql(query).fetchall()

# Step 3: Display each image with metadata
plt.figure(figsize=(15, 4))

for i, (img_bytes, path, timestamp, description, air_temp, wave_h) in enumerate(results):
    image = Image.open(io.BytesIO(img_bytes))

    plt.subplot(1, 5, i + 1)
    plt.imshow(image)
    plt.axis('off')
    plt.title(f"{description}\n{timestamp}\n{air_temp}°C / {wave_h}m", fontsize=8)

plt.tight_layout()
plt.show()
10: Other | Mini Search Engine for Environmental Data using Hugging Face and Open-Source Models#
Semantic search model: https://huggingface.co/sentence-transformers/all-MiniLM-L6-v2
Example Dataset: https://huggingface.co/datasets/brianofrim/NOAA_buoycams/
from sentence_transformers import SentenceTransformer
from sklearn.metrics.pairwise import cosine_similarity
import duckdb
import pandas as pd
import matplotlib.pyplot as plt
from PIL import Image
import io
# Connect to DuckDB and enable HTTP FS access
con = duckdb.connect()
con.execute("INSTALL httpfs;")
con.execute("LOAD httpfs;")
# Query Parquet: image bytes + structured metadata
query = """
SELECT
jpg.bytes,
jpg.path,
json ->> 'timestamp' AS timestamp,
json ->> 'description' AS description,
json ->> 'air_temperature_c' AS air_temp,
json ->> 'wave_height_m' AS wave_h
FROM 'hf://datasets/brianofrim/NOAA_buoycams@~parquet/default/validation/*.parquet'
WHERE jpg.bytes IS NOT NULL
"""
results = con.sql(query).fetchall()
# Build records with full text + metadata + image bytes
records = []
for img_bytes, _, timestamp, description, air_temp, wave_h in results:
if description and air_temp and wave_h:
desc_text = f"{description}, {timestamp}, air: {air_temp}°C, waves: {wave_h}m"
records.append({
"desc": desc_text,
"image_bytes": img_bytes,
"metadata": {
"description": description,
"timestamp": timestamp,
"air_temperature_c": air_temp,
"wave_height_m": wave_h
}
})
# Build embeddings
texts = [r["desc"] for r in records]
model = SentenceTransformer("all-MiniLM-L6-v2")
embeddings = model.encode(texts)
# Query embedding
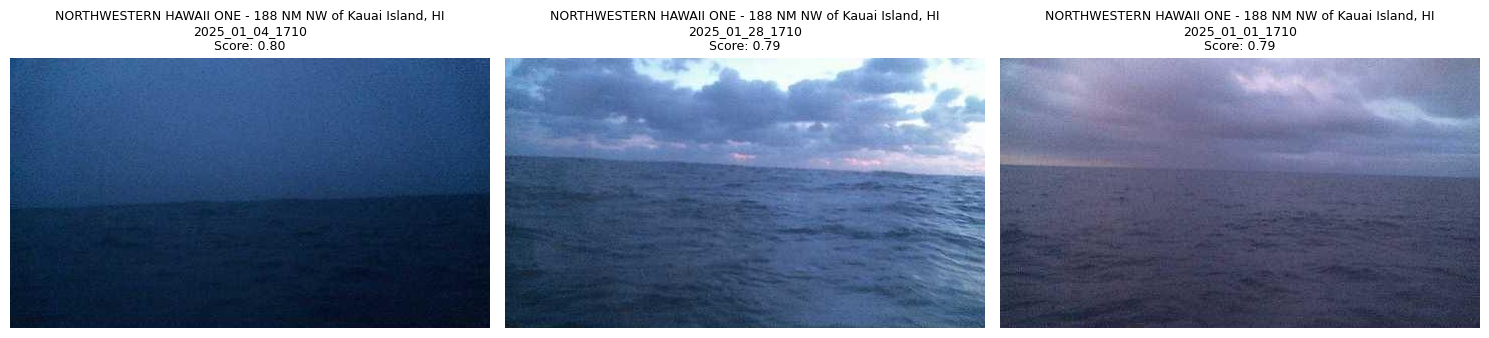
query = "Cold air and high waves near Hawaii"
query_embedding = model.encode([query])
sims = cosine_similarity(query_embedding, embeddings)[0]
# Rank by similarity
ranked = sorted(zip(records, sims), key=lambda x: -x[1])
# Print + Plot top 3 results
top_n = 3
print(f"🔍 Top matches for query: {query}\n")
plt.figure(figsize=(5 * top_n, 5))
for i, (r, score) in enumerate(ranked[:top_n]):
print(f"Score: {score:.2f}")
print("→", r["desc"])
print()
# Show image
image = Image.open(io.BytesIO(r["image_bytes"]))
plt.subplot(1, top_n, i + 1)
plt.imshow(image)
plt.axis("off")
plt.title(f"{r['metadata']['description']}\n{r['metadata']['timestamp']}\nScore: {score:.2f}", fontsize=9)
plt.tight_layout()
plt.show()
🔍 Top matches for query: Cold air and high waves near Hawaii

Score: 0.80
→ NORTHWESTERN HAWAII ONE - 188 NM NW of Kauai Island, HI, 2025_01_04_1710, air: 24.3°C, waves: 4.0m

Score: 0.79
→ NORTHWESTERN HAWAII ONE - 188 NM NW of Kauai Island, HI, 2025_01_28_1710, air: 19.5°C, waves: 2.3m

Score: 0.79
→ NORTHWESTERN HAWAII ONE - 188 NM NW of Kauai Island, HI, 2025_01_01_1710, air: 24.3°C, waves: 2.1m